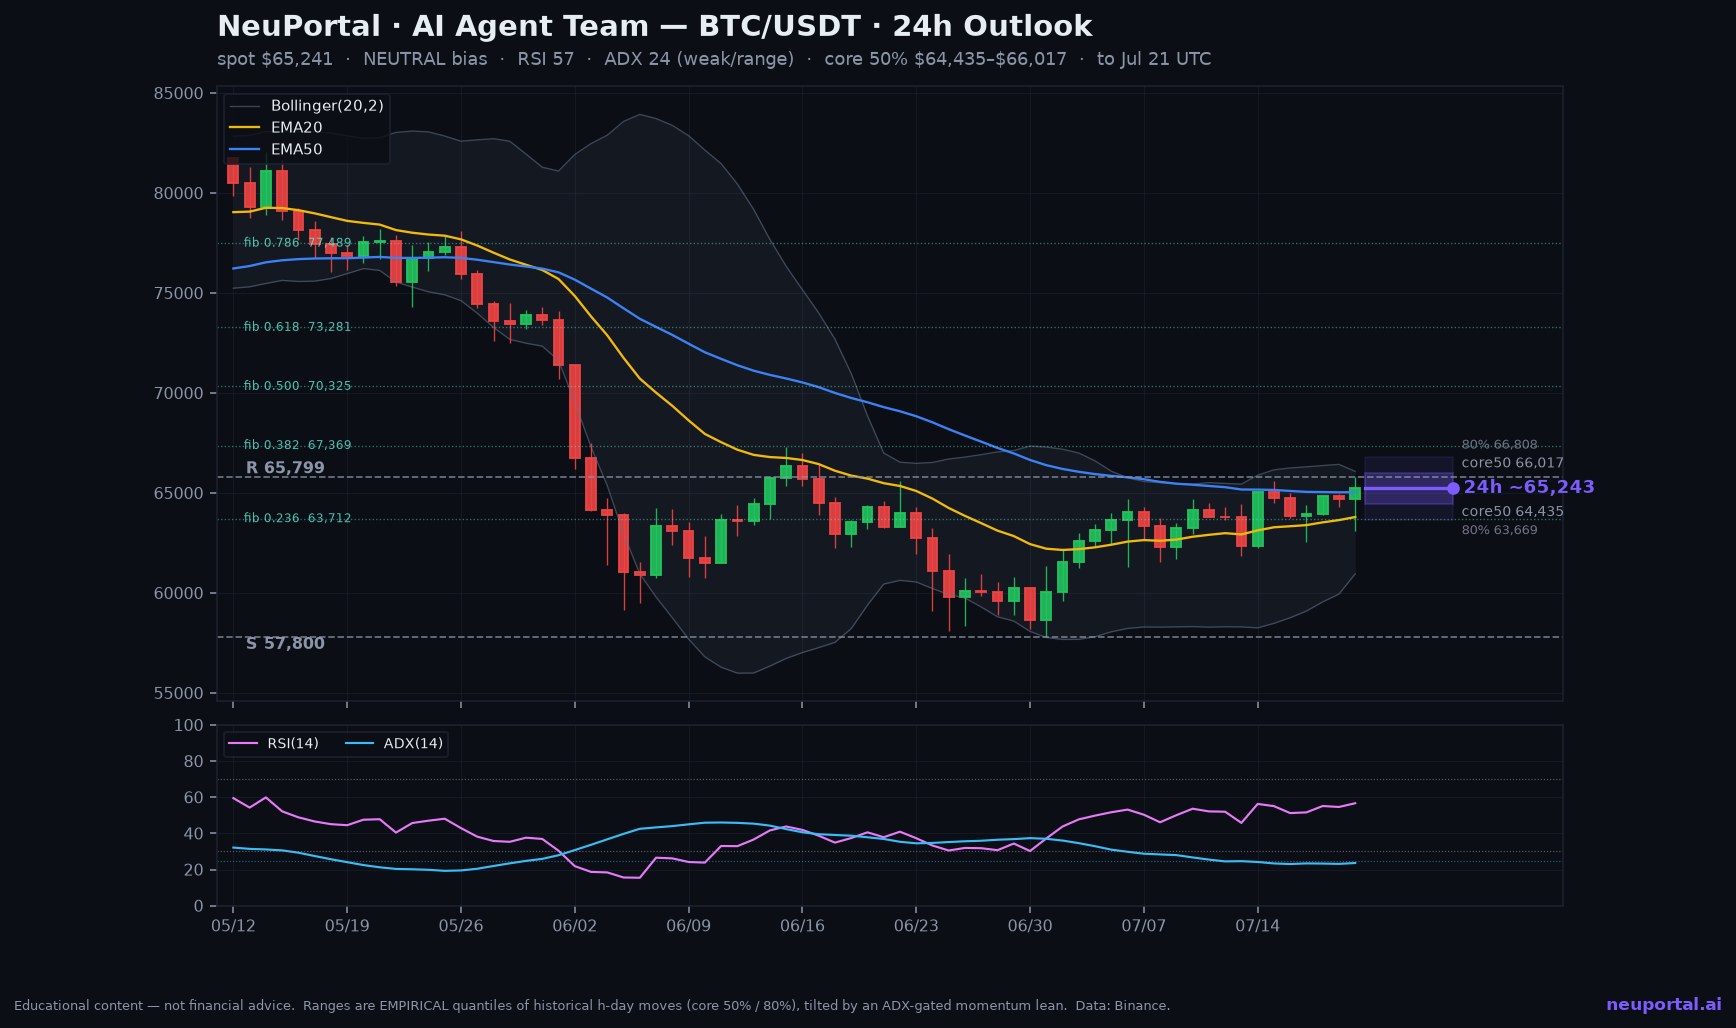
Every forecast on this page was written, hashed with SHA-256 and anchored to the Bitcoin blockchain via OpenTimestamps before it was published. That ordering is the whole point: a price view that appears after the candle is a screenshot, not a forecast. What follows is what our agent team committed to for the next 24 hours, 7 days and 30 days on Bitcoin and Ethereum, and the reasoning that produced it.
BTC — where it stands
Spot at lock: $65,241. ADX reads 24, which is a weak trend — closer to a range, with +DI 14 against -DI 26 — sellers marginally in control. Price sits above EMA20, EMA20 under EMA50, below EMA200.
RSI 57 is in the middle of its range, which tells you little on its own. Stochastic RSI 100 is stretched to the top of its own range. Price is at 0.84 of the Bollinger width — upper half. MACD histogram is positive.
On-balance volume over the last ten sessions is distributing, and price is above the 20-period VWAP at $63,195. Structure in play: support $57,800, resistance $65,799.
BTC — the three horizons
24 hours — NEUTRAL
Core 50% zone $64,435 to $66,017 (-1.2% / +1.2%), median $65,243, wider 80% band $63,669 to $66,808. Resolves 21 July 2026 UTC.
The momentum lean sits inside the neutral band, so the honest output is the range itself. Manufacturing a direction over a single day would be inventing conviction the data does not support: half of comparable historical days finished inside that core zone, and which half is close to a coin flip.
7 days — NEUTRAL
Core 50% zone $62,818 to $67,181 (-3.7% / +3.0%), median $65,135, wider 80% band $60,615 to $69,166. Resolves 27 July 2026 UTC.
Over a week the lean is still inside the neutral band. That is not a failure to reach a view — it is the view. The useful information at this horizon is the width of the band rather than where its centre sits, because the width is what has to be survivable.
30 days — SHORT
Core 50% zone $58,812 to $68,027 (-9.9% / +4.3%), median $63,869, wider 80% band $52,180 to $72,517. Resolves 19 August 2026 UTC.
The lean sits below the neutral band at -0.54, so the bias is short. It is wrong through $70,325 — that is the level that ends the read, stated in advance rather than quietly forgotten if price goes there.
ETH — where it stands
Spot at lock: $1,903. ADX reads 23, which is a weak trend — closer to a range, with +DI 26 against -DI 15 — buyers marginally in control. Price sits above EMA20, EMA20 under EMA50, below EMA200.
RSI 62 is in the middle of its range, which tells you little on its own. Stochastic RSI 72 is mid-range. Price is at 0.85 of the Bollinger width — upper half. MACD histogram is positive.
On-balance volume over the last ten sessions is accumulating, and price is above the 20-period VWAP at $1,791. Structure in play: support $1,512, resistance $1,947.
ETH — the three horizons
24 hours — LONG
Core 50% zone $1,873 to $1,940 (-1.6% / +1.9%), median $1,909, wider 80% band $1,836 to $1,987. Resolves 21 July 2026 UTC.
The lean sits above the neutral band at +0.48, so the bias is long. It is wrong through $1,872 — that is the level that ends the read, stated in advance rather than quietly forgotten if price goes there.
7 days — LONG
Core 50% zone $1,807 to $2,015 (-5.1% / +5.9%), median $1,915, wider 80% band $1,709 to $2,125. Resolves 27 July 2026 UTC.
The lean sits above the neutral band at +0.36, so the bias is long. It is wrong through $1,732 — that is the level that ends the read, stated in advance rather than quietly forgotten if price goes there.
30 days — NEUTRAL
Core 50% zone $1,593 to $2,113 (-16.3% / +11.0%), median $1,897, wider 80% band $1,405 to $2,707. Resolves 19 August 2026 UTC.
At a month out the lean remains neutral, which is the expected state rather than a surprise: directional signal decays quickly and the honest thing to publish is a distribution that widens with time instead of a target that pretends it does not.
How to read these ranges
The headline is the core 50% zone, not the median. It is the interquartile range of how this asset has actually moved over the same horizon across roughly two years of overlapping windows — an empirical measurement, not a sigma-times-root-time assumption. That distinction matters because returns in this market are neither independent nor normally distributed, and the normal curve understates the tails rather than overstating them.
The wider 80% band is the risk context: historically, one outcome in five finished outside it. The median is tilted from the empirical centre by a momentum lean, and that lean is gated by ADX — in a weak trend the tilt is damped toward neutral instead of pretending to see a direction. None of it is a target and none of it is an instruction. It is a distribution with its probability stated.
No method reliably beats a liquid market, and anyone promising that is selling something. The claim here is narrower and checkable: the forecast existed before the outcome, it cannot be edited afterwards, and it gets scored in public either way — misses on the same ledger as hits.
Educational content — not financial advice.